Kindly read DISCLAIMER before proceeding.
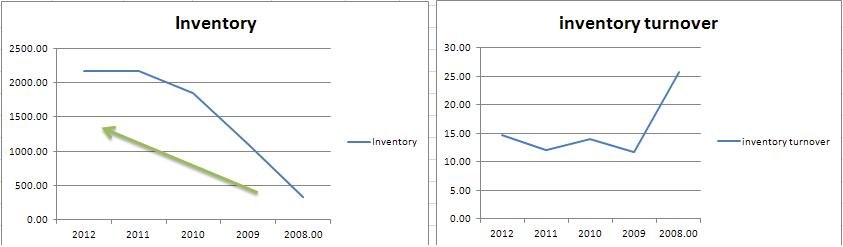
1. Inventory seems increasing for its previous 5 year history. This is a sign of having a competitive advantage (to be able to anticipate and provide when the demand needs it); currently having an average of 1,527.40 MILLION PHP. With its INVENTORY TURNOVER RATIO, the company sold their inventory at an average of 15.65 times during the 5 year period, highlighting the 2008 period as the highest (25.70 times). Currently, its ratio is at 14.68 times.
1. Inventory seems increasing for its previous 5 year history. This is a sign of having a competitive advantage (to be able to anticipate and provide when the demand needs it); currently having an average of 1,527.40 MILLION PHP. With its INVENTORY TURNOVER RATIO, the company sold their inventory at an average of 15.65 times during the 5 year period, highlighting the 2008 period as the highest (25.70 times). Currently, its ratio is at 14.68 times.
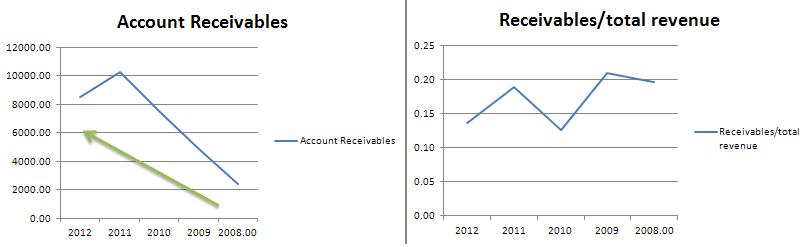
2. Net Receivables
For stringent measures, using net receivables matched with total revenue, the company has an average of 0.17.
For the CURRENT RECEIVABLE TURNOVER RATIO: it is identified (2011-2012) to have 6.62 times a year or a receivable to be translated to cash every 55.14 days or almost 2 months.
For stringent measures, using net receivables matched with total revenue, the company has an average of 0.17.
For the CURRENT RECEIVABLE TURNOVER RATIO: it is identified (2011-2012) to have 6.62 times a year or a receivable to be translated to cash every 55.14 days or almost 2 months.
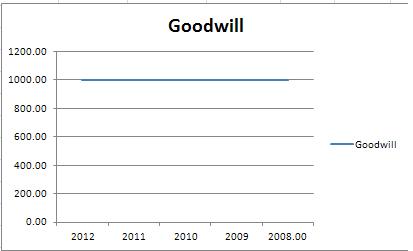
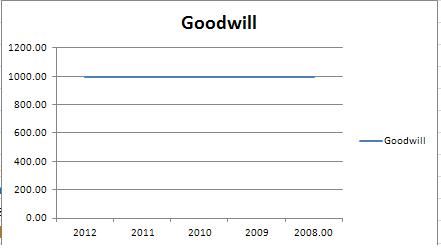
3. Goodwill or Blue-skying
This item has been unchanged since the 2008 period. Averaging at 996 MILLION PHP.
This item has been unchanged since the 2008 period. Averaging at 996 MILLION PHP.
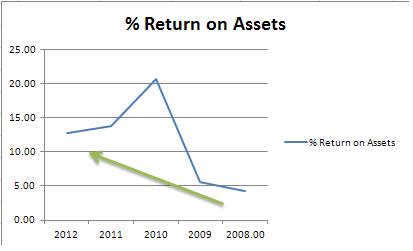
4. Return on Assets Ratio
a. Stringent approach (Net Earnings/Total Assets): 12.38%
b. Less-stringent approach (EBIT/Total Assets): 11.41% *
Looking at the trend, it is still valid to assume that there is still an increase in this ratio despite a spike in the 2010 period.
*It seems that it is somehow conflicting in my math that I had little a bit value in my ‘less stringent’ calculation than the stringent approach; reader may ignore this area here to avoid confusion.
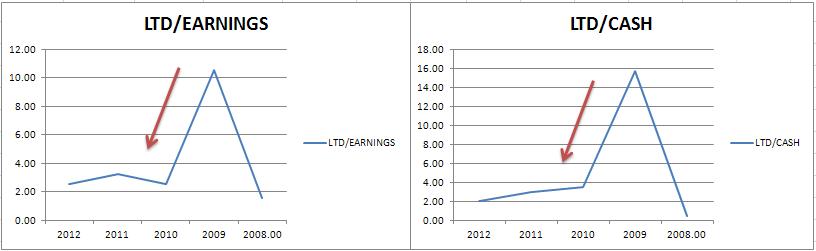
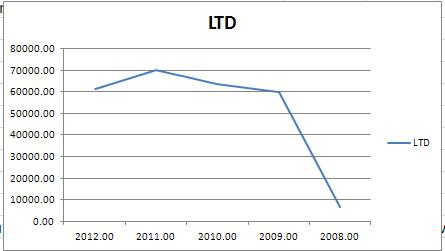
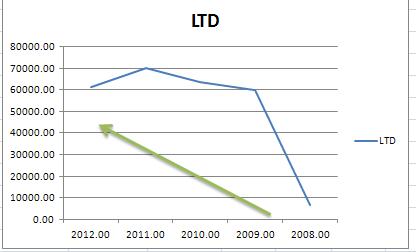
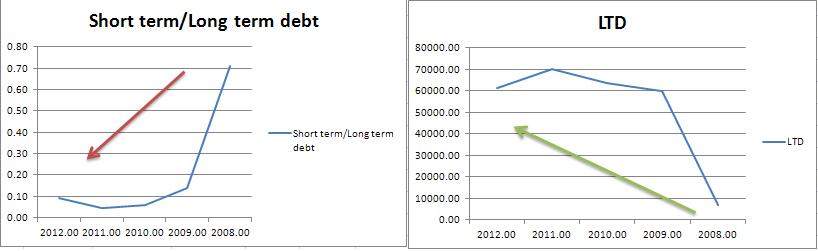
5. Long Term Debt value
a. LTD matched with company’s earnings
Having an average of 4.09 ratio, it is clearly drawn on the graph that the company is in a good condition on lessening its long term debt
With the hypothetical case: if noted the current 2012 year’s LTD and net earnings maintained; the question is, will it be able to pay for the magnate’s time limit of 3-4 years?
Answer will be NO, having their business included in those of highly competitive industry.
b. To have LTD compared to its cash and equivalents shows a similar situation with the foregoing. Therefore may be also said that the company is becoming ‘stronger’ in cash position. The average ratio to cash is 4.93.
It can still be concluded that the business is still funding some <> more of its operations through committing long term debt.
6. Total liability and Debt/Equity ratio
This will be primarily used to compare to other companies and to seek for the said advantage if the company would have at least an average ratio <0.8, as 0.54.
This will be primarily used to compare to other companies and to seek for the said advantage if the company would have at least an average ratio <0.8, as 0.54.
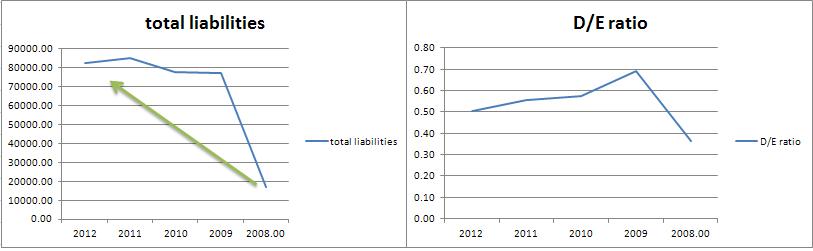
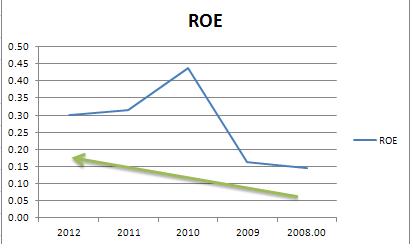
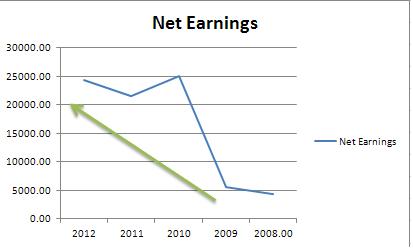
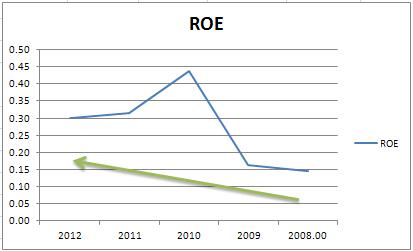
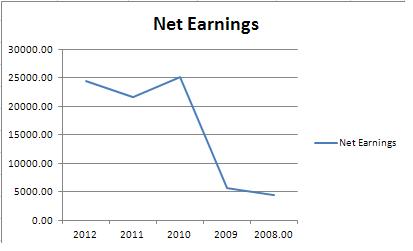
7. Return on Shareholder’s equity (ROE)
ROE remains in a steady increasing state with an average of 0.27. As displayed, each specified item seems to be ‘inline’ with the upward trend of the company’s net earnings.
ROE remains in a steady increasing state with an average of 0.27. As displayed, each specified item seems to be ‘inline’ with the upward trend of the company’s net earnings.
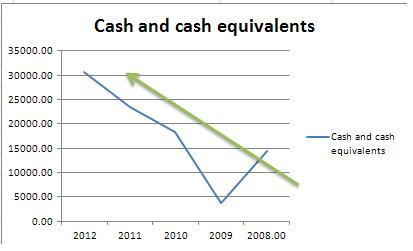
8. Cash and its Equivalents
This item shows that the company’s cash is relatively increasing and obtaining an average of at least 18, 104.20 MILLION PHP.
It will then be compared with: LTD, PPE, NET EARNINGS, DILUTED EPS, GOODWILL, and INTANGIBLES.
List of sensible questions:
1. Is it increasing because company is ingesting more debt? Probably
2. Is it increasing because PPE is increased? Probably
3. Is it increasing because NET EARNINGS is increased? Can be
4. Is it increasing yet it is properly reflected through its DILUTED EPS? Yes
5. Has it been used to decrease the company’s goodwill? No
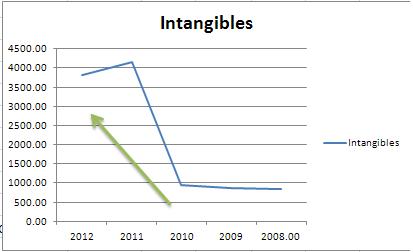
6. Has it been used to decrease the company’s intangibles? No
This item shows that the company’s cash is relatively increasing and obtaining an average of at least 18, 104.20 MILLION PHP.
It will then be compared with: LTD, PPE, NET EARNINGS, DILUTED EPS, GOODWILL, and INTANGIBLES.
List of sensible questions:
1. Is it increasing because company is ingesting more debt? Probably
2. Is it increasing because PPE is increased? Probably
3. Is it increasing because NET EARNINGS is increased? Can be
4. Is it increasing yet it is properly reflected through its DILUTED EPS? Yes
5. Has it been used to decrease the company’s goodwill? No
6. Has it been used to decrease the company’s intangibles? No
|
|
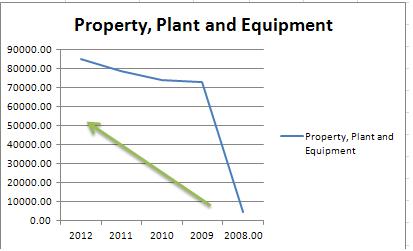
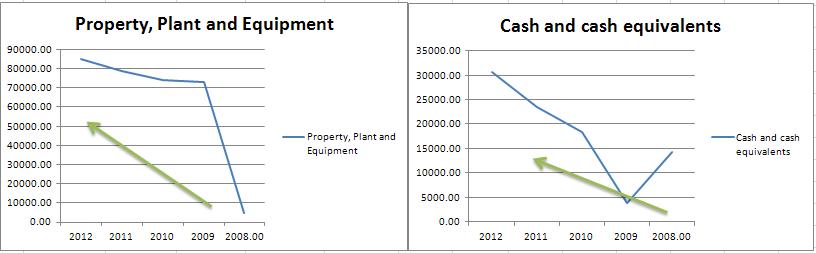
9. Property, Plant and Equipments
A. Property matched with LTD
Both items are in a ‘directly’ proportional state in this scenario, in which it might have been better to just see the PPE increasing while the LTD is decreasing.
B. Property matched with Cash
This pushes the company to a better spot due to its relative ‘direct’ relationship between the two items, which identifies a durable competitive advantage criterion in one of the Magnate’s checklist.
10. Current Liabilities
In this item, the company is showing strengths of decreasing its current debt (short term debt) as to matching it with the long term debt with an average of 0.21 ratio over the 5 year period.
This is despite that its RECEIVABLE TURNOVER RATE is just 6.62 times a year.
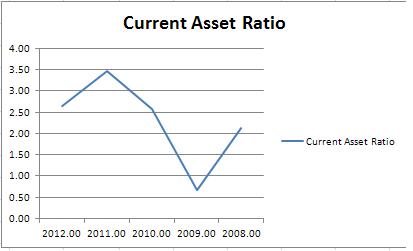
Current ratio
The company’s current asset ratio is at 2.30 which met one of Mr. Graham’s standards.
In this item, the company is showing strengths of decreasing its current debt (short term debt) as to matching it with the long term debt with an average of 0.21 ratio over the 5 year period.
This is despite that its RECEIVABLE TURNOVER RATE is just 6.62 times a year.
Current ratio
The company’s current asset ratio is at 2.30 which met one of Mr. Graham’s standards.
11. Treasury shares
NO NOTES on STOCK REPURCHASES MADE.
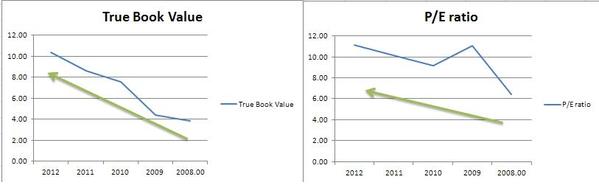
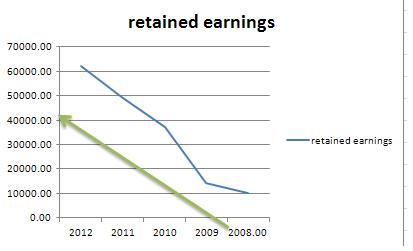
12. NET TANGIBLE ASSET, “THE BOOK VALUE”
Based on the findings on the chart, it shows that the company is attaining a steady increase in its book value. However, this good buy junior security seems to be well noticed (in a way) by the market already. Having an average current P/E ratio of 9.59, this is still a bit low with Mr. Graham’s choosing of P/E <15 (should the junior security pass his quantitative assessments).
NO NOTES on STOCK REPURCHASES MADE.
12. NET TANGIBLE ASSET, “THE BOOK VALUE”
Based on the findings on the chart, it shows that the company is attaining a steady increase in its book value. However, this good buy junior security seems to be well noticed (in a way) by the market already. Having an average current P/E ratio of 9.59, this is still a bit low with Mr. Graham’s choosing of P/E <15 (should the junior security pass his quantitative assessments).
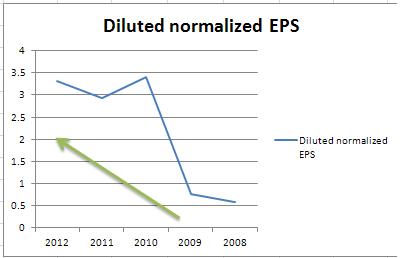
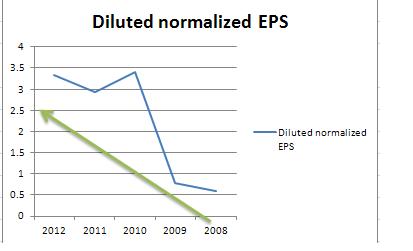
13. Return on Equity
It is observed, that the ROE of the company is fluctuating (so as to its EPS). Anything fluctuating within the previous 5 year history may be considered susceptible in the ‘economic booms and busts’ for the fledgeling investor. Therefore, with this finding when matched with the previous junior security dissected may also be labeled with being a somewhat but NOT TOTALLY a ‘mediocre company’ (with its agreeable findings in the foregoing).
It is observed, that the ROE of the company is fluctuating (so as to its EPS). Anything fluctuating within the previous 5 year history may be considered susceptible in the ‘economic booms and busts’ for the fledgeling investor. Therefore, with this finding when matched with the previous junior security dissected may also be labeled with being a somewhat but NOT TOTALLY a ‘mediocre company’ (with its agreeable findings in the foregoing).
|
|
MY
12/26/2013
12/26/2013
Donate a $1
