Dissecting the INCOME STATEMENT: (Main information of values from FT.COM and supplemental values from Annual Report 2008-2013-see references by end of Cash Flow statement)
Before proceeding: Kindly read DISCLAIMER and take note that the fledgeling investor had just one company to compare the current information to (this may produce a non-generalized bias).
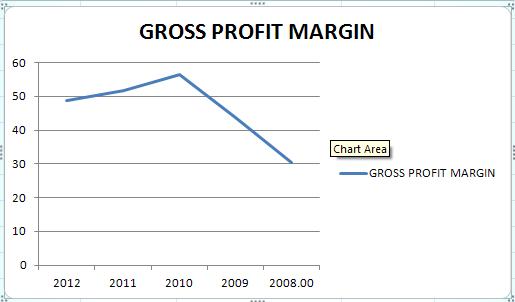
1. GROSS PROFIT MARGIN:
The key term here is consistency; it seems that AP is STABLE; coming off at a rise from the ’08-‘09 period then slightly declining previous years since 2010. 46.17 as average margin for the previous five year period (2008-2012).
This company certainly has one of the criteria to be labeled as one having the DURABLE COMPETITIVE ADVANTAGE above FPH.
Before proceeding: Kindly read DISCLAIMER and take note that the fledgeling investor had just one company to compare the current information to (this may produce a non-generalized bias).
1. GROSS PROFIT MARGIN:
The key term here is consistency; it seems that AP is STABLE; coming off at a rise from the ’08-‘09 period then slightly declining previous years since 2010. 46.17 as average margin for the previous five year period (2008-2012).
This company certainly has one of the criteria to be labeled as one having the DURABLE COMPETITIVE ADVANTAGE above FPH.
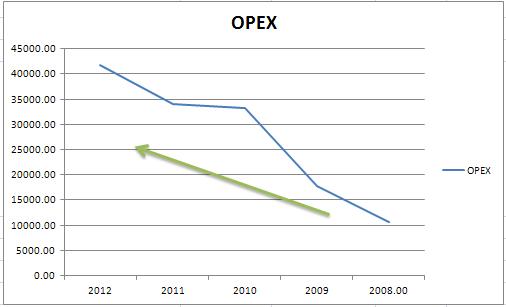
2. OPERATING EXPENSES (OPEX)
The company is definitely experiencing increase in its expenses to maintain its profitability (including salaries, advertising, licensing fees, accounting fees and research and development). A 293.98% jump from the 2008 low, an average of 27,494 MILLION PHP, AND A 22.28% increase from 2011’s OPEX.
The company is definitely experiencing increase in its expenses to maintain its profitability (including salaries, advertising, licensing fees, accounting fees and research and development). A 293.98% jump from the 2008 low, an average of 27,494 MILLION PHP, AND A 22.28% increase from 2011’s OPEX.
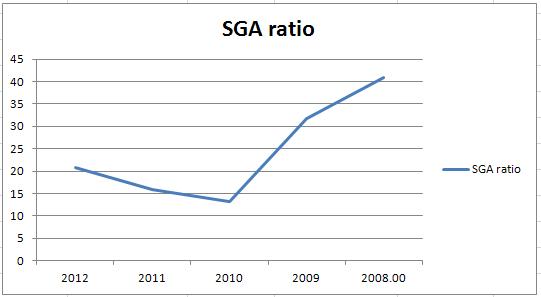
3. SELLING, GENERAL AND ADMIN EXPENSES (SGA)
This item also shows a favorable response over the given 5 year period. AP has shown an average of 24.29% (and providing a decline of 49% from the 2008 HIGH).
Given that it is earning well (despite increasing its OPEX). Its SGA declined and not to forget, Buffet’s <30% SGA is well considered to be fantastic.
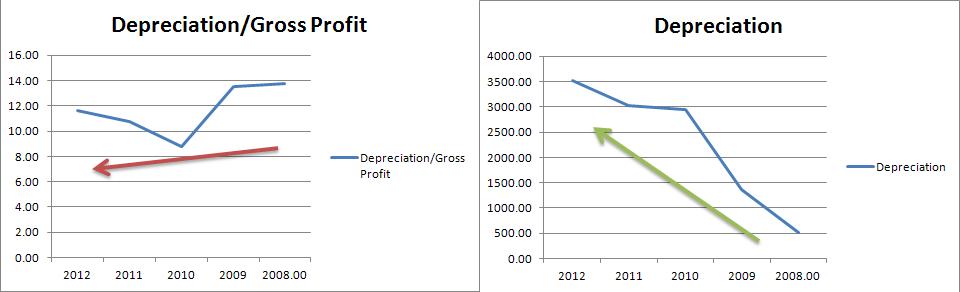
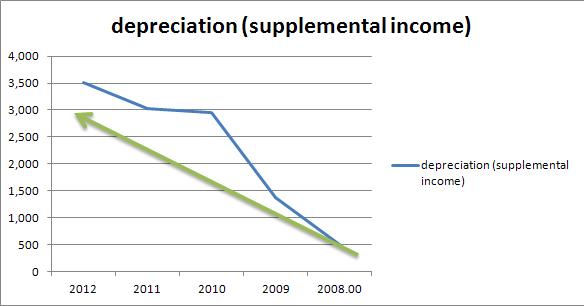
4. DEPRECIATION/AMORTIZATION
A 588.06% increase from the 2008 low, while having an average of a 2,276.80 MILLION PHP is still a bit low than the initial industrial stock dissected.
Matched with Gross Profit, it has a 5 year average ratio of 11.70% (still a bit lower than the initial stock dissected).
A 588.06% increase from the 2008 low, while having an average of a 2,276.80 MILLION PHP is still a bit low than the initial industrial stock dissected.
Matched with Gross Profit, it has a 5 year average ratio of 11.70% (still a bit lower than the initial stock dissected).
5.
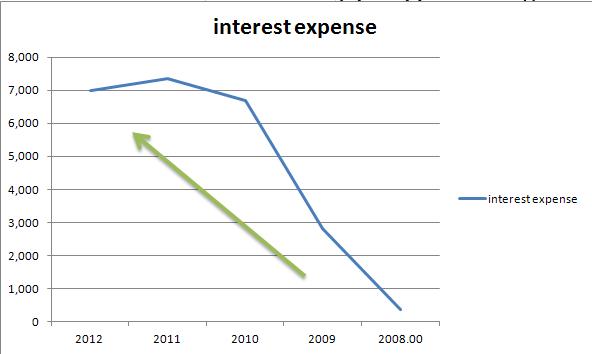
INTEREST EXPENSES/DEBT INTEREST
AP has the average of 34.0619% (2008-2012) with the debt expenses, still off from what the sage magnate’s requirement of at least <15%, yet important to compare to other peers.
AP has the average of 34.0619% (2008-2012) with the debt expenses, still off from what the sage magnate’s requirement of at least <15%, yet important to compare to other peers.
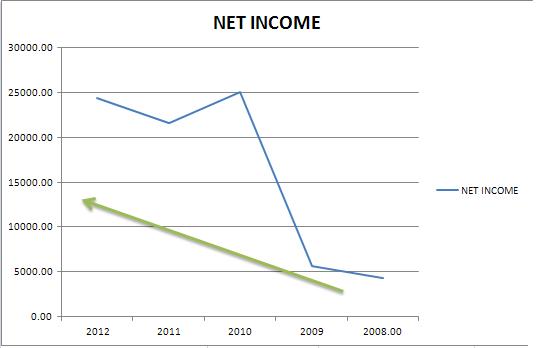
6. NET EARNINGS
A notable increase in this item with a 463.15% increase from the low 2008 period and having an average of at least 16,209.80 MILLION PHP.
Matching it with its TOP LINE, is had an average of a 36.16%, which in Mr. Buffet DCA criteria to have the EDGE.
A notable increase in this item with a 463.15% increase from the low 2008 period and having an average of at least 16,209.80 MILLION PHP.
Matching it with its TOP LINE, is had an average of a 36.16%, which in Mr. Buffet DCA criteria to have the EDGE.
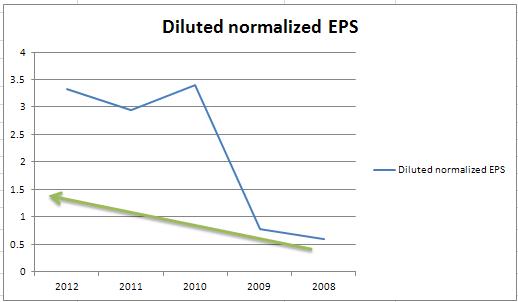
7. DILUTED EARNINGS PER SHARE (2008-2012)
Not much of a fluctuation can be seen here, but a 462.71% jump from the 2008 low; the company has an average EPS of at least 2.20.
Not much of a fluctuation can be seen here, but a 462.71% jump from the 2008 low; the company has an average EPS of at least 2.20.
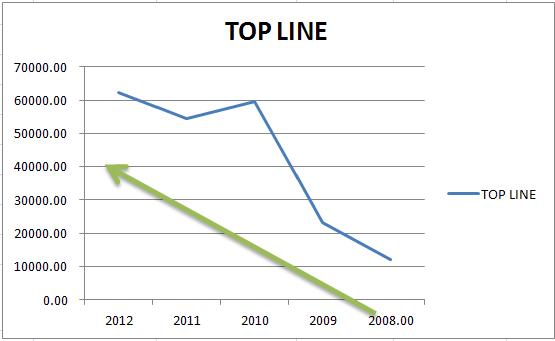
8. TOP LINE/TOTAL REVENUE
As has been illustrated earlier by the NET earnings, it is also experiencing a steady increase in this segment; to be specific, a 409.66% jump from the 2008 low, with the average of 42,319 MILLION PHP.
No signs of the dreaded PRO FORMA INCOME.
As has been illustrated earlier by the NET earnings, it is also experiencing a steady increase in this segment; to be specific, a 409.66% jump from the 2008 low, with the average of 42,319 MILLION PHP.
No signs of the dreaded PRO FORMA INCOME.
9. COST OF REVENUE
The company is exhibiting a favorable state in this item, due to its 26% decrease from the 2008 Cost of revenue to Total Revenue. Signifies a consistent business model (2008-2012 period).
The company is exhibiting a favorable state in this item, due to its 26% decrease from the 2008 Cost of revenue to Total Revenue. Signifies a consistent business model (2008-2012 period).
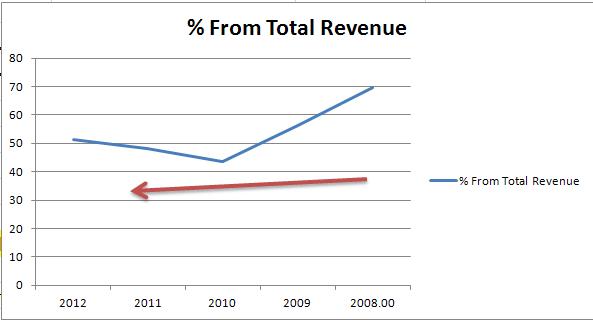
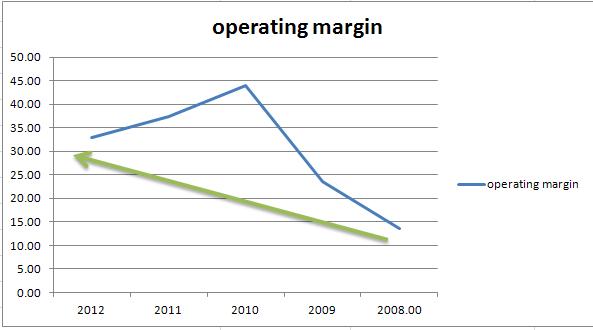
10. % RETAINED ON EACH PHP INVESTED
(NOT INCLUDE)Peeking through the future of the company, its core of business, its profitability and how well cost controlling
The company is having a stable operating margin (core of business/profitability) with an average of 30.27%. 2012 had experience a decline of 8.61% from 2011 and an overall decrease of 25% from the 2010 high.
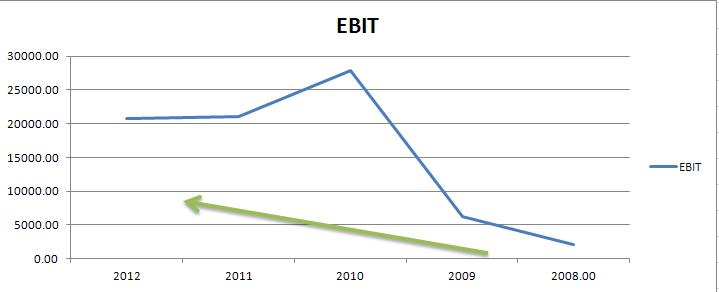
11. Earnings Before Interest and Taxes (EBIT)
Known as the company’s efficiency in making money resulted to an average of at least 16.63% when matched with its total revenue.
Known as the company’s efficiency in making money resulted to an average of at least 16.63% when matched with its total revenue.
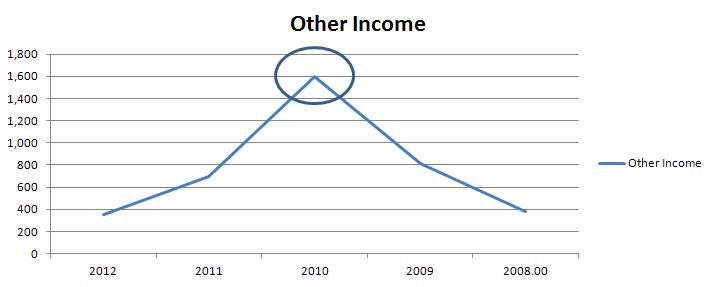
12. Other Income
As to the dividends earned; investment interests, and foreign currency gains for this company, it had declined 78% from the 2010 high, and at least 60% from the average of 870.75 MILLION PHP to 351 MILLION PHP.
As to the dividends earned; investment interests, and foreign currency gains for this company, it had declined 78% from the 2010 high, and at least 60% from the average of 870.75 MILLION PHP to 351 MILLION PHP.
13. Non-recurring items/events
NONE to note about
14. As to its supplemental income,
Depreciation has an average of 2,276.80 MILLION PHP (as stated above); and NONE for SPECIAL ITEMS.
NONE to note about
14. As to its supplemental income,
Depreciation has an average of 2,276.80 MILLION PHP (as stated above); and NONE for SPECIAL ITEMS.
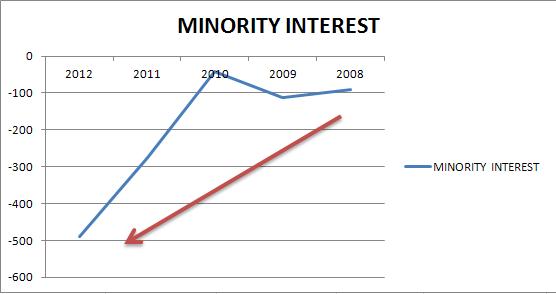
15. For its Minority Interest, it seems that the company’s other ‘minority share investments’ are growing with an average (2009-2012) of 148.62% yearly.
M.Y.
12/25/2013
12/25/2013
Donate a $1
