Dissecting the INCOME STATEMENT: (As a parent company, every piece here is consolidated and was provided by its annual reports from 2008 to 2013; also, additional important figures were gathered from ft.com (see references for exact links).
KINDLY READ DISCLAIMER FIRST PRIOR TO PROCEEDING TO THIS SECTION
1. GROSS PROFIT MARGIN:
KINDLY READ DISCLAIMER FIRST PRIOR TO PROCEEDING TO THIS SECTION
1. GROSS PROFIT MARGIN:
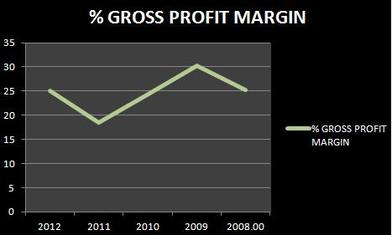
The key term here is consistency; it seems that FPH is consistently stable having an average of 24.69 MARGIN for the previous five year period (2008-2012).
As Warren Buffet may have put it as his book (link to reference), companies experiencing <40% have other competitors eroding this specific margin- industry is in a competitive industry. As we have mentioned the list of existent companies engaged in the similar industry (power generating primarily was made as the point of comparison*).
*the company’s sole existence is not just for investing in power generation it is also investing in real estate development, roads and toll ways operations, manufacturing and construction, financing and other service industries.
To be compared to other similar industries.
2. OPERATING EXPENSES (OPEX)
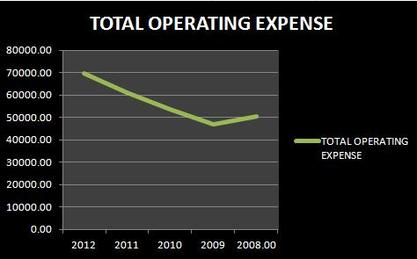
It seems that the co. is slightly challenged this year compared to its previous year, increasing of about 14% from 2011’s expenses; and can be more distinguished comparing it to the 2009 performance (increasing by at least 48%); having an average of 56,353.80 MILLION PHP.
These expenses are necessary to run the business (including salaries, advertising, licensing fees, accounting fees and research and development).
This just shows even though that the co. is experiencing a tough competition year after year, it is still up to its mission to outlast other competitors by spending this operating expenses for the potential growth in the future.
As to comparing this to its Gross Profit, it seems that this is a confirmatory that it is in the competitive side and also having to spend more to keep its profit at par.
To be compared to other similar industries.
3. SELLING, GENERAL AND ADMIN EXPENSES (SGA)
These are the sum of all direct (advertising) and indirect selling (in-house expenses) expenses (recurring yearly)
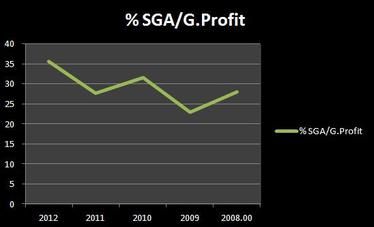
It can be calculated that the company (despite in a highly competitive industry/ies); still had maintained a modest average of 29.17% (‘08-‘12). It may be observed that the 2012 SGA% had increased at least 56% from a ’09 low.
As Warren Buffet may have put it <30% of gross profit is fantastic, and having or nearing greater or equal than 100% would have meant it is engaging in a highly competitive industry.
To be compared to other similar industries.
4. DEPRECIATION/AMORTIZATION
This determines how much asset’s value has been used up.
This money is at it is stated (Supplemental income); which is money set aside and may be used elsewhere in order for it to gain more interest prior to utilizing the budget in replacing any of its represented items in the future.
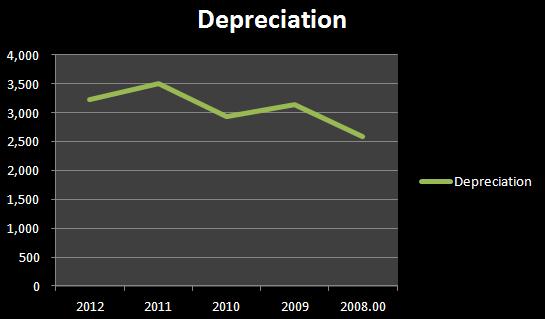
An increase of at least 25% from the ‘08 low of 2,590 MILLION PHP, other than that, it looks like the company is maintaining at least ~3 Billion PHP for its depreciating tools and equipments yearly (talk about power generation utilities depreciating).
Having it matched with its gross profit, it seems it has a minor increase in 2011 for its depreciative entry as supplemental income, but was still able to keep its 5 year average to less than 20% (~19.35%);
To be compared to other similar industries.
5. INTEREST EXPENSES/DEBT INTEREST
Durable competitive advantage for the sage magnate will be to have at least <15% Or the one having the least interest expense possible among its peers
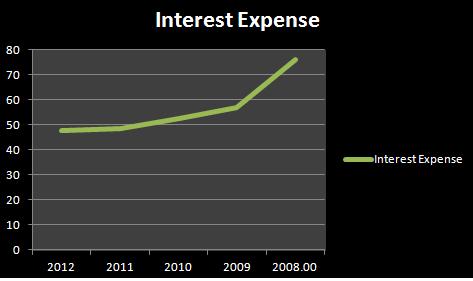
In here, shows a bit of a weak point for the company having an average of at least 56.31% (’08-’12) when matched with its operating income. Pretty far from what was least to be mentioned and expected for the aforementioned personality.
To be compared to other similar industries.
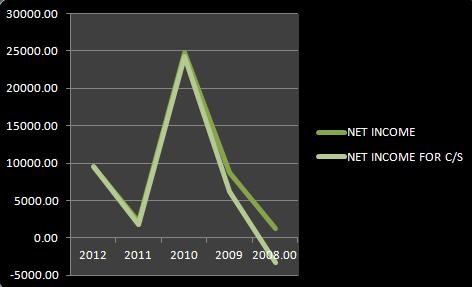
6. NET EARNINGS
Increasing its net earnings from a 2008 low of -3,264 MILLION PHP to 9,552 MILLION PHP in 2012; the company has maintained an average of 7,696.2 MILLION PHP on the previous five year history.
To be compared to other similar industries.
Then using the durable competitive advantage, having it matched with its total revenue; we have at least an average of 14.13% ratio, and at his right, there was no label as to digits found between 10-20%, and that less than 10 is a bad sign, and greater than 20 was a good sign, leaving this average as a mediocre in my judgment.
To be compared to other similar industries.
6. NET EARNINGS
Increasing its net earnings from a 2008 low of -3,264 MILLION PHP to 9,552 MILLION PHP in 2012; the company has maintained an average of 7,696.2 MILLION PHP on the previous five year history.
To be compared to other similar industries.
Then using the durable competitive advantage, having it matched with its total revenue; we have at least an average of 14.13% ratio, and at his right, there was no label as to digits found between 10-20%, and that less than 10 is a bad sign, and greater than 20 was a good sign, leaving this average as a mediocre in my judgment.
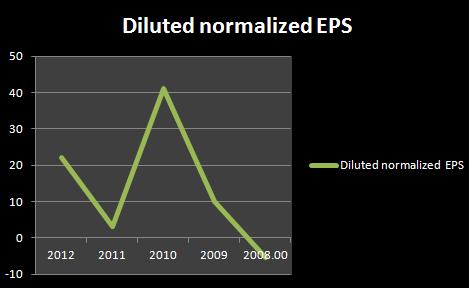
7.
DILUTED EARNINGS PER SHARE (2008-2012)
These set of values (due to its fluctuation) is identified to signify that the company is ‘prone to boom and bust and that the industry it is in is fiercely competitive’
These set of values (due to its fluctuation) is identified to signify that the company is ‘prone to boom and bust and that the industry it is in is fiercely competitive’
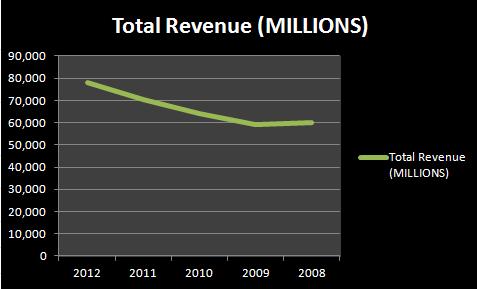
8. TOP LINE/TOTAL REVENUE
My best thought on the total revenue of the co is that it is on an accrual basis (as I have taken from its real estate notes)
Overall, it is increasing without any signs of PRO FORMA INCOME.
Benjamin Graham clearly denounces any entity that has this kind of existing value in their financial statements as quoted, "that has not yet learned how to put its shareholders’ long-term interests first."
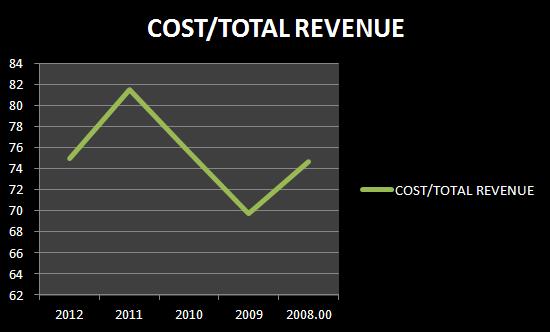
9. COST OF REVENUE
it seems like the company has a stable increasing cost of revenue which is good and is a sign of progress, however, as one may note a company’s efficiency, it must have a showing of slightly decreasing % off from the total revenue-it seems that based on its highly competitive industry it still has an average of 75.31% from a low of 69.77% in 2009.
To be compared to other similar industries
10. % RETAINED ON EACH PHP INVESTED
Peeking through the future of the company, its core of business, its profitability and how well cost controlling
It has decreased of at least -30.37% from the 5 year average and that it had a -47.59% drop from 09 high of 20.48% to 10.73%
To be compared to other similar industries.
Peeking through the future of the company, its core of business, its profitability and how well cost controlling
It has decreased of at least -30.37% from the 5 year average and that it had a -47.59% drop from 09 high of 20.48% to 10.73%
To be compared to other similar industries.
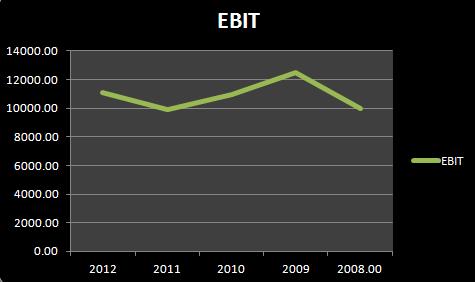
11. Earnings Before Interest and Taxes (EBIT)
Known as the company’s efficiency in making money resulted to an average of at least 16.63% when matched with its total revenue.
To be compared to other similar industries.
Known as the company’s efficiency in making money resulted to an average of at least 16.63% when matched with its total revenue.
To be compared to other similar industries.
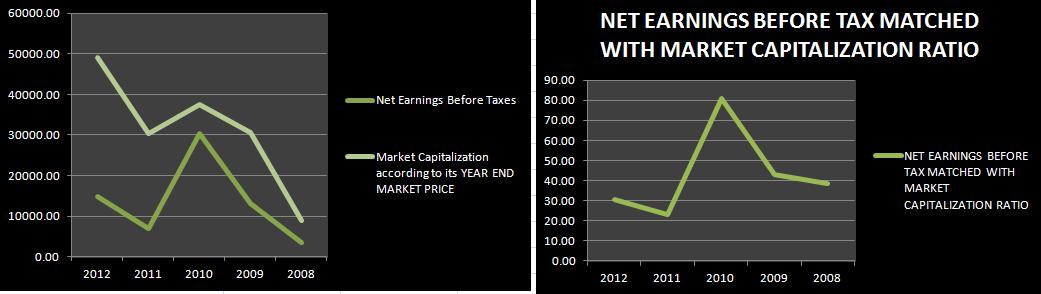
12. Earnings Before Taxes (income before tax line)
Looking at its current values to use and ascertain its projection, unsurprisingly FPH had its outstanding year on 2010 by having at least a percent pre-taxed return of 80.82% on an average of 43.1%.
The company has apparently being valued by the market somehow relatively at each year-end (set as MY Market Price) as to its consistency and growth performance. (Which is surprising, if we tend to presume that majority of the local market now is more democratic with the use of TA rather than FA). This is important to look out for consistency and growth for a co to be outlined as a stable and growing co respectively.
However, further assessing the value, one may see that its ratio remains challenge as it is fluctuating and ‘slightly’ a bit lesser than its 08 level (-21%).
To be compared to other similar industries.
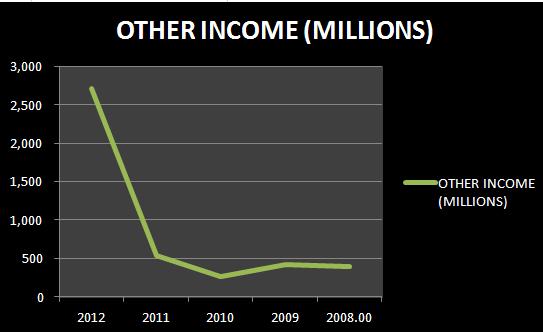
13. Other Income
These are dividends earned; investment interests, and foreign currency gains, which are primarily claimed as the business line of the company (see its co profile)
Having an average of 406.50 MILLION PHP and a sudden jump in ‘12’s performance of an astounding 568.39%
These are dividends earned; investment interests, and foreign currency gains, which are primarily claimed as the business line of the company (see its co profile)
Having an average of 406.50 MILLION PHP and a sudden jump in ‘12’s performance of an astounding 568.39%
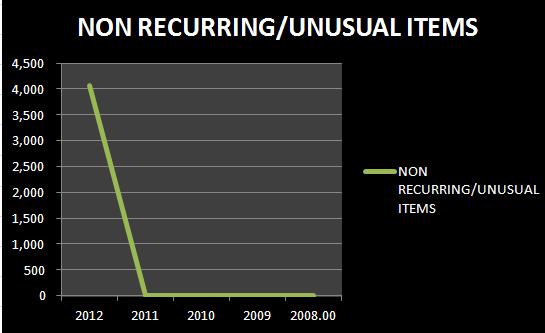
14. Non-recurring items/events
I may suspect this item (Non-recurring items) as Unusual Expense (income)
It seems that there was just this onetime non-recurring expense of 4,075 MILLION PHP (2012); no other unusual items posted in the previous and that is noted as an impairment loss
Check FPH’s annual report of 2012 pages 144-146 (notes 11 and 12) for more details.
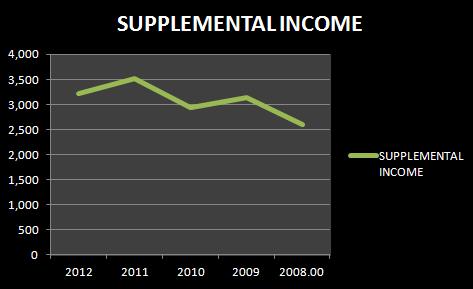
15. In outlining its Supplemental Income (DEPPRECIATION + OTHER INCOME), we observed that it has a stable average of 3,078.40 MILLION PHP stated as its depreciating amortization; this may be used for other investments until the items being depreciated is well at its end life (given that with its management identified as able to reroute its investments skillfully—as it is showing in the OTHER INCOME)
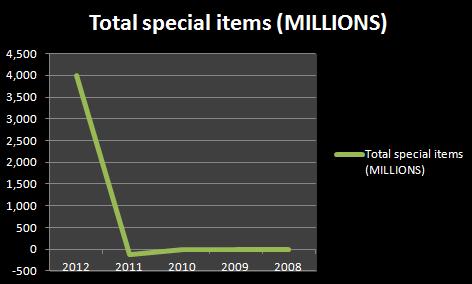
16. Discoursing about the total special items here, it seems that there was a significant increase in its TOTAL SPECIAL ITEMS of about 417.45% from the average of 773.60 MILLION PHP with that single 4,003 MILLION PHP bringing the average high up than its regular average TOTAL SPECIAL ITEMS of -33.75 MILLION PHP prior.
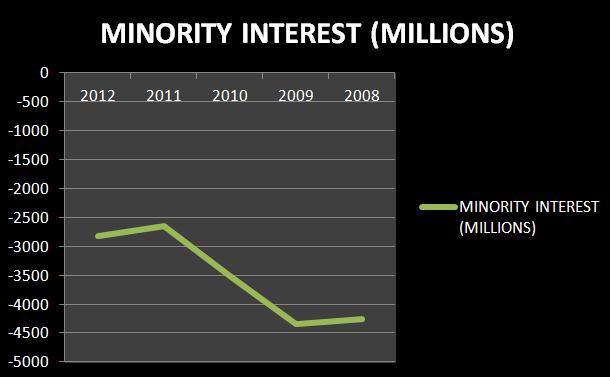
17. Last item we will be stating here is its Non-controlling interest (NCI) or in basic language, the value that the company may not have a hand on.
Which we may identify as increasing as it is skewing to the left (from ’08-’12; right to left) as seen on the chart rather.
Which we may identify as increasing as it is skewing to the left (from ’08-’12; right to left) as seen on the chart rather.
M.Y.
12/22/2013
12/22/2013
Donate a $1
