KINDLY READ DISCLAIMER FIRST PRIOR TO PROCEEDING TO THIS SECTION
Balance Statement
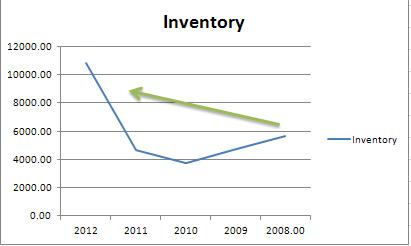
We start of at its (1) INVENTORY, and matching it with its net earnings, This is as relative as to comparison for that we are able to see its ‘durable competitive advantage’ above the rest of its competitors; and indicates that it is looking for its profitable ways to increase sales (increasing inventory) in order to fill all the demand from its clientel.
The company is experiencing an increase in its inventory, now with an average of 5,915 MILLION PHP. As has been previously stated, the company is looking to or probably anticipating an increase in demand in its services that is why it is increasing its inventory (a sign of a ever competitive company).
As to its INVENTORY TURNOVER RATIO, the company sold their inventory at an average of 9.49 times during the 5 year period, highlighting the 2010 period as the highest (13.10 times) ergo representing a spike also at the net earnings for the stockholders. The co had been challenged a bit in the turnover performance during the 2012 period and had taken a dip of -43% from the average.
It is important to note that increasing ratio leads to increasing efficiency in using its inventory to generate revenue.
Balance Statement
We start of at its (1) INVENTORY, and matching it with its net earnings, This is as relative as to comparison for that we are able to see its ‘durable competitive advantage’ above the rest of its competitors; and indicates that it is looking for its profitable ways to increase sales (increasing inventory) in order to fill all the demand from its clientel.
The company is experiencing an increase in its inventory, now with an average of 5,915 MILLION PHP. As has been previously stated, the company is looking to or probably anticipating an increase in demand in its services that is why it is increasing its inventory (a sign of a ever competitive company).
As to its INVENTORY TURNOVER RATIO, the company sold their inventory at an average of 9.49 times during the 5 year period, highlighting the 2010 period as the highest (13.10 times) ergo representing a spike also at the net earnings for the stockholders. The co had been challenged a bit in the turnover performance during the 2012 period and had taken a dip of -43% from the average.
It is important to note that increasing ratio leads to increasing efficiency in using its inventory to generate revenue.
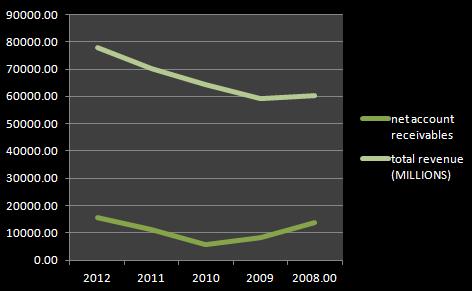
Next on the list will be the (2) Net Receivables, money that is owed by its clientel and are not yet paid for deducting from it the less-reliable receivable accounts (clients who may be delinquent).
I used total revenues; this is a more stringent assessment rather than computing for its net CREDIT sales/revenue. Having an average ratio of 0.16, this still has to be compared with other similar industries.
Another thing I have learned was the CURRENT RECEIVABLE TURNOVER RATIO: whereby the faster a company can turn receivables into cash; the better and the lesser chance for delinquent accounts (from Chris Williams of PerfectStockAlert.com)
This ratio shows that it is doing a turnover rate of just 5.83 times a year (To be compared to other similar industries), and thus it tells us that for a receivable to turn into cash, it will take every 62.61 days or every 2 months.
It is important to note that the longer the receivable, the longer it can be turned into cash, the longer the company’s money tied up. This, instead of having it invested in other profitable investments. This says something about the business model efficiency of the company. However, it must be noted that different companies have different credit length for their respective clientel-we’re just reflecting their respective quantitative numbers here.
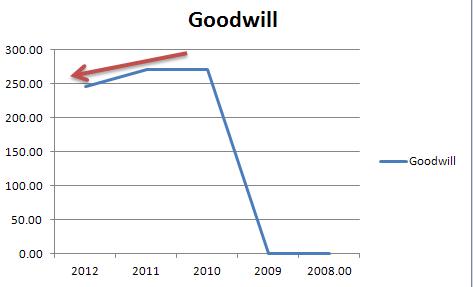
3. Goodwill or Blue-skying, known as the premium the co. paid for any of its acquisitions achieved. Blue sky as in Graham’s succinctly words, “So named, because the purchaser receives no more than ‘blue sky’ for his money.”
This item may be labeled good if it is consistent, meaning that the company is underpaying or not acquiring any company, or if increasing, an analyst must decipher if the company is then buying other companies with competitive advantage as well.
This item may be labeled good if it is consistent, meaning that the company is underpaying or not acquiring any company, or if increasing, an analyst must decipher if the company is then buying other companies with competitive advantage as well.
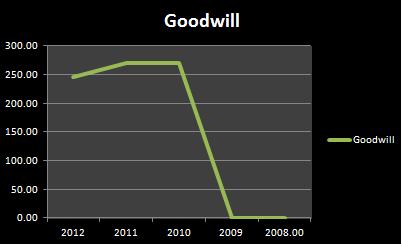
it seems that the company is maintaining its average of 157.60 MILLION PHP since an entry in ’10; and written off at least 25 million in the previous year ’12.
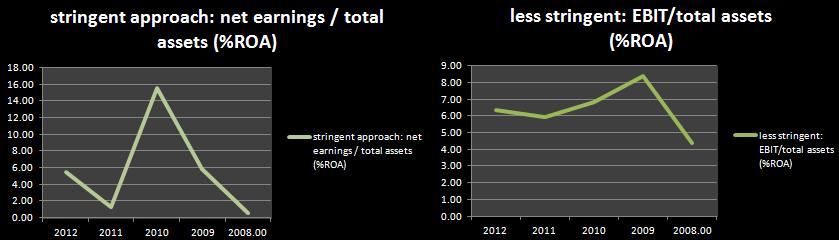
4. Next will be Return on Assets Ratio, This is to state the company’s durable competitive advantage (more importantly for monumental and established companies).
Having only to attain the 5-year average here for the following:
A. Stringent approach (Net Earnings/Total Assets): 5.72% vs. down to 5.46% for the year ‘12
B. Less-stringent approach (EBIT/Total Assets): 6.38% vs. down to 6.34% for the year ‘12
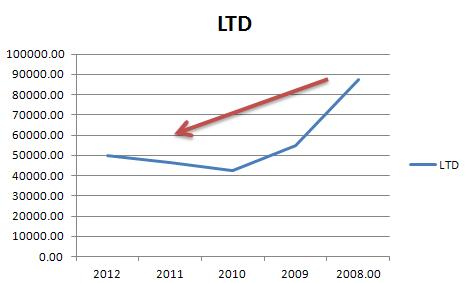
5. Next will be the interesting Long Term Debt value. Although the sage already stated that he had to see the previous 10 year history of this specific item, I had failed to deliver such length due to my limited capacity of retrieving such information, however, I have here are the previous 5 year history. To be liberal, A. is LTD matched with company’s earnings, B. is LTD matched with company’s cash (cash equivalents and short term investments).
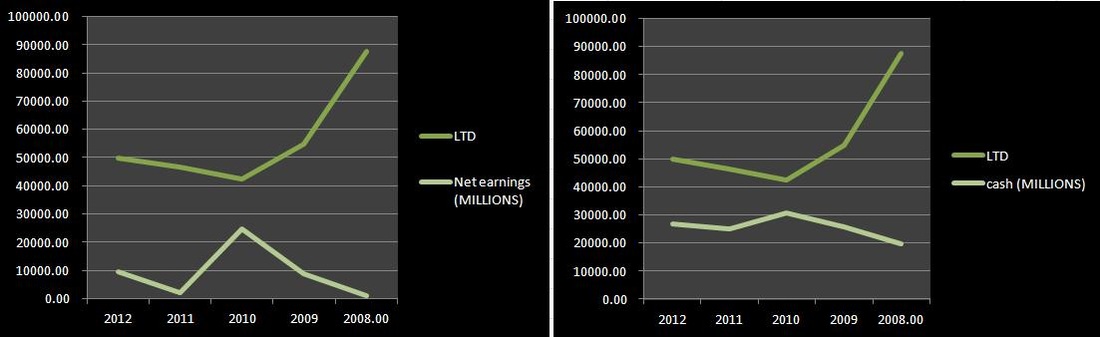
a. As the Magnate stated on his book, It is important to note that a company must have sufficient net earnings average to pay for long term debt in 3-4 years, this also indicates that a company with little to no debt shows that it is capable of self-financing (rather than asking money from other institutions) for necessary expansion.
As stated in the table, the company had an outstanding increase of at least 269.20% in net earnings, except for the -91.48% in 2011.
Given any hypothetical case: if noted the current 2012 year’s LTD and net earnings maintained; the question is, will it be able to pay for the magnate’s time limit of 3-4 years?
Answer will be NO, (multiplying the current earnings by 4 years then deducting it to current long term debt); this is probably due to the preceding sections and highlights stating that the co. is in a highly competitive industry.
b. One note, however, as can be observed from the graph when compared to its current cash, the company was able to dampen its debt as to it increasing its cash and cash equivalents (with short term investments); which is a sign of it becoming a stronger company.
Either way, it is still funding most of its operations through engaging more in debt rather than with its net earnings (which is lacking for the previous years to support its growth).
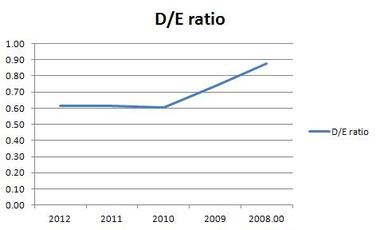
6. Total liability and Debt/Equity ratio
This will be primarily used to compare to other companies and to seek for the said advantage if the company would have at least an average ratio <0.8, as 0.69.
To be compared to other similar industries.
As stated in the table, the company had an outstanding increase of at least 269.20% in net earnings, except for the -91.48% in 2011.
Given any hypothetical case: if noted the current 2012 year’s LTD and net earnings maintained; the question is, will it be able to pay for the magnate’s time limit of 3-4 years?
Answer will be NO, (multiplying the current earnings by 4 years then deducting it to current long term debt); this is probably due to the preceding sections and highlights stating that the co. is in a highly competitive industry.
b. One note, however, as can be observed from the graph when compared to its current cash, the company was able to dampen its debt as to it increasing its cash and cash equivalents (with short term investments); which is a sign of it becoming a stronger company.
Either way, it is still funding most of its operations through engaging more in debt rather than with its net earnings (which is lacking for the previous years to support its growth).
6. Total liability and Debt/Equity ratio
This will be primarily used to compare to other companies and to seek for the said advantage if the company would have at least an average ratio <0.8, as 0.69.
To be compared to other similar industries.
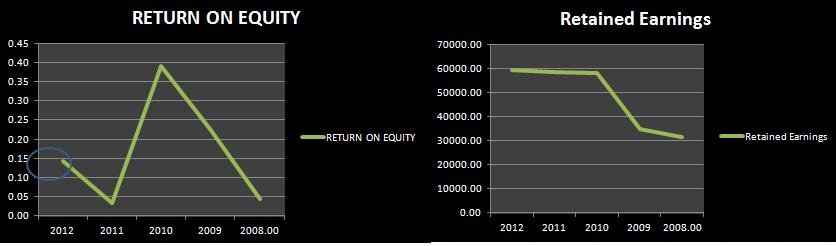
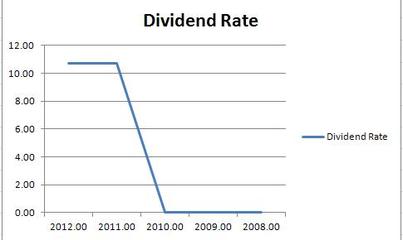
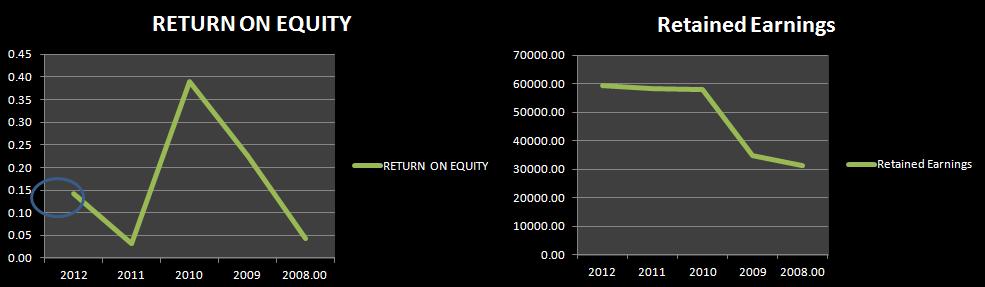
7. Return on Shareholder’s equity (ROE)
Shareholder’s interest indeed had a hiccup on 2011 and therefore (with just 5-year history) may be considered as fluctuating, what we were looking for was for the company to have a steadily increasing ROE.
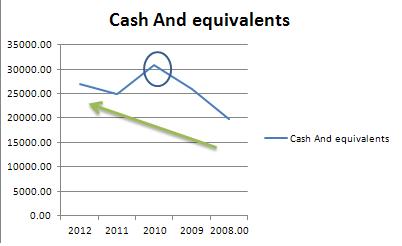
One intriguing fact on this item is that the company (may be) does not need to retain earnings and rather pay dividend back to its shareholders, however, in this case, one may see with the value for dividend tracking 08-2013, that the company might have instead overpaid its shareholders (of the 10.72 PHP/share) on the 2011 period, and was able to ‘recover’ a bit on 2012’s similar dividend rate (see circle in chart).
Shareholder’s interest indeed had a hiccup on 2011 and therefore (with just 5-year history) may be considered as fluctuating, what we were looking for was for the company to have a steadily increasing ROE.
One intriguing fact on this item is that the company (may be) does not need to retain earnings and rather pay dividend back to its shareholders, however, in this case, one may see with the value for dividend tracking 08-2013, that the company might have instead overpaid its shareholders (of the 10.72 PHP/share) on the 2011 period, and was able to ‘recover’ a bit on 2012’s similar dividend rate (see circle in chart).
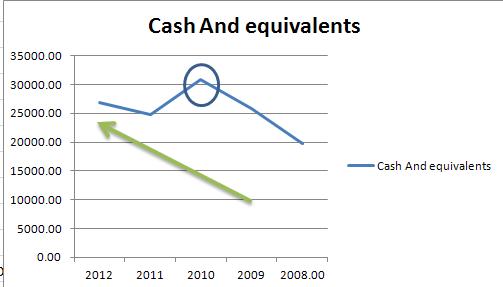
8. Cash and its Equivalents
The company is experiencing a stable increase since ’09 values, producing an average of at least 25,631.80 MILLION PHP yearly (take note of the shoot up of 30,815 Million PHP in 2010). This supposes either of the 3 circumstances the company:
1. Company is getting more in debt to finance its activities,
2. Company is selling property plants (decreasing its intrinsic value to get more cash),
3. Company is just having a robust economy over the 5-year period.
Circumstance number 1 doesn’t apply to this overall 5 year period; however, it may be contrasted with the relatively short period of 2011-2012.
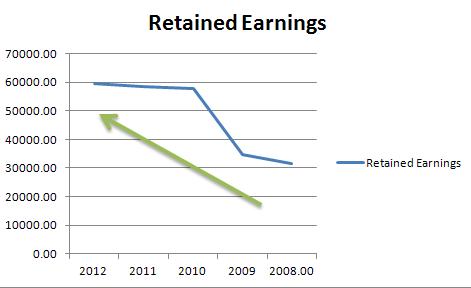
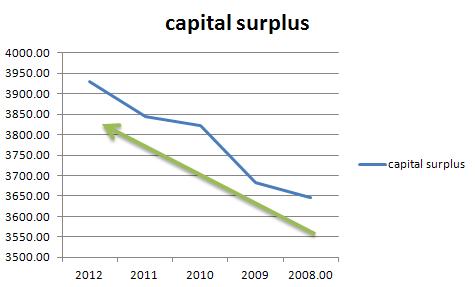
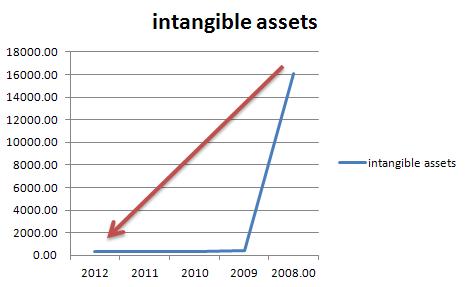
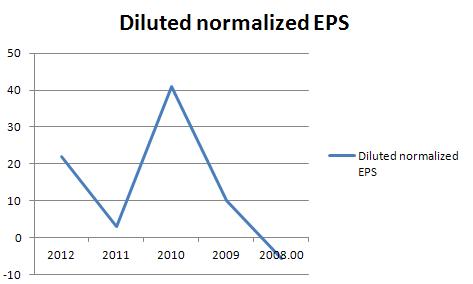
Having it juxtapose now to company’s stated retained earnings and capital surpluses, one may observe that it IS apparently increasing with the two, ergo, may and should result to increase in EPS too. However when it (CASH and EQUIVALENTS) had to be singly compared with its DILUTED EPS, it may prove disproportional rather fluctuating for the latter (instead that it should have been relatively increasing); which lead me to have it compared with its GOODWILL and INTANGIBLE ASSETS whereby it may not be any observable change in the GOODWILL’s except for the ‘minor’ deduction of at least 25 Million PHP (2012 from 2011) and the remarkable difference of 2013’s 15, 810 Million PHP from the 2008’s INTANGIBLE ASSET values. (SEE CHARTS)
Probably with the fluctuating EPS, (rather than a cohesive performance with its capital surplus and having it compared directly with capital surplus and the company’s intangible assets) Mr. Graham himself may be worth quoted on this ‘happening’ and rather than the naïve investor paraphrase it, he stated that, “Experience would confirm the established verdict of the stock market that a dollar of earnings is worth more to the stockholder if paid him in dividends than when carried to surplus.”
The company is experiencing a stable increase since ’09 values, producing an average of at least 25,631.80 MILLION PHP yearly (take note of the shoot up of 30,815 Million PHP in 2010). This supposes either of the 3 circumstances the company:
1. Company is getting more in debt to finance its activities,
2. Company is selling property plants (decreasing its intrinsic value to get more cash),
3. Company is just having a robust economy over the 5-year period.
Circumstance number 1 doesn’t apply to this overall 5 year period; however, it may be contrasted with the relatively short period of 2011-2012.
Having it juxtapose now to company’s stated retained earnings and capital surpluses, one may observe that it IS apparently increasing with the two, ergo, may and should result to increase in EPS too. However when it (CASH and EQUIVALENTS) had to be singly compared with its DILUTED EPS, it may prove disproportional rather fluctuating for the latter (instead that it should have been relatively increasing); which lead me to have it compared with its GOODWILL and INTANGIBLE ASSETS whereby it may not be any observable change in the GOODWILL’s except for the ‘minor’ deduction of at least 25 Million PHP (2012 from 2011) and the remarkable difference of 2013’s 15, 810 Million PHP from the 2008’s INTANGIBLE ASSET values. (SEE CHARTS)
Probably with the fluctuating EPS, (rather than a cohesive performance with its capital surplus and having it compared directly with capital surplus and the company’s intangible assets) Mr. Graham himself may be worth quoted on this ‘happening’ and rather than the naïve investor paraphrase it, he stated that, “Experience would confirm the established verdict of the stock market that a dollar of earnings is worth more to the stockholder if paid him in dividends than when carried to surplus.”
|
|
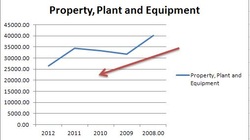
9. Property, Plant and Equipments
These are usually the necessary expenses to maintain a company’s fixed assets. PPE taken into two comparisons here: first, PPE matched with its Long term debt and second, PPE matched with its Cash and Equivalents.
For the former, it demonstrates that the company is having its (industrial/manufacturing, etc) plants being depreciated and that it is not acquiring any much needed debt for such occurrence, whereby one may rather expect that PPE would have increased in any rate and kept or even better lessen its Debt from the previous years.
Next is to have it matched with its Cash and Equivalents, where it can be observed to have an indirect correlation. This is a bit off from what the ‘durable competitive advantage’ the book of Mr. Buffet here refers to as he would always want to have the Cash and Equivalents increase in relation with its PPE.
|
|
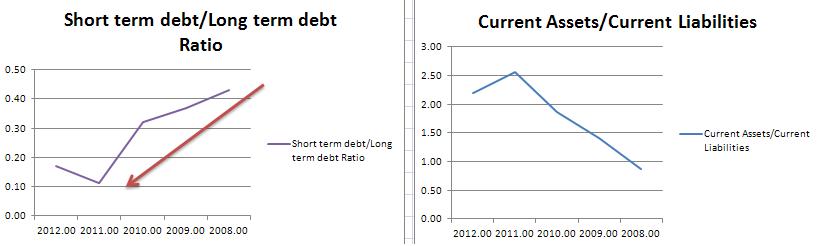
10. Current Liabilities
In this aspect, the company shows stability (through a steady down trend) and having an average of 0.28 over the 5-year period. This is despite that its RECEIVABLE TURNOVER RATE is just 5.83 times a year.
In this relationship of short term matched with its long term debts; it is much preferable to have fewer short term ratios to its long term, this promotes less aggressive and leveraged businesses and therefore may promote more efficiency in its business model in allocating funds more to its expansion rather than just paying interests somewhere else.
Current ratio
With this in mind, as can be seen in the other chart, the salient investor requires a co to have at least >2 when the current assets matched with its current liabilities as a co that may be able to deliver to its short term obligations, in which the company has passed.
To be compared to other similar industries.
11. Treasury shares
Companies that tend to buy back shares have a credible edge to those who are not. As stated at its 2012 annual report page 166, “In 2012, the Parent Company did not buy back additional shares. In 2011, the Parent Company bought back an additional 29,753,630 shares at an average cost per share of P=57.79 or equivalent to….”
This 57.79 PHP/share is at least at a discount of ~35% from the 89.4 December 2012 Market Price.
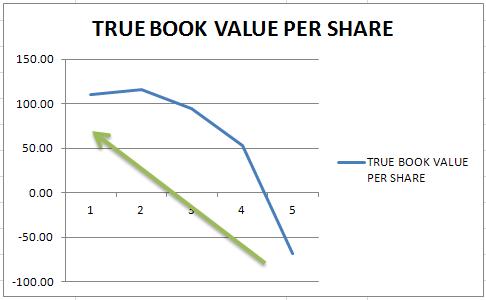
12. NET TANGIBLE ASSET, “THE BOOK VALUE”
Calculated as Total Assets-Intangible Assets-Goodwill-All Liabilities-Par Value of Preferred Stock
It can be explicated that the company’s REAL value is steadily increasing over the previous 5-year history. This is one of the reasons why I decided to do the small research behind the company’s financial statements. With the current 52 week low (December 2013) value of 48.9; we’re having at least 56% discount from the ’12 True Book Value.
Companies that tend to buy back shares have a credible edge to those who are not. As stated at its 2012 annual report page 166, “In 2012, the Parent Company did not buy back additional shares. In 2011, the Parent Company bought back an additional 29,753,630 shares at an average cost per share of P=57.79 or equivalent to….”
This 57.79 PHP/share is at least at a discount of ~35% from the 89.4 December 2012 Market Price.
12. NET TANGIBLE ASSET, “THE BOOK VALUE”
Calculated as Total Assets-Intangible Assets-Goodwill-All Liabilities-Par Value of Preferred Stock
It can be explicated that the company’s REAL value is steadily increasing over the previous 5-year history. This is one of the reasons why I decided to do the small research behind the company’s financial statements. With the current 52 week low (December 2013) value of 48.9; we’re having at least 56% discount from the ’12 True Book Value.
13. Return on Equity
It is observed, that the ROE of the company is fluctuating (so as to its EPS). It is good to recognize that an increasing ROE means that the company is making good use of the retained earnings in adding to its business value and a declining or negative value may indicate that the company may well have low net earnings and low assets ergo a mediocre company.
It is observed, that the ROE of the company is fluctuating (so as to its EPS). It is good to recognize that an increasing ROE means that the company is making good use of the retained earnings in adding to its business value and a declining or negative value may indicate that the company may well have low net earnings and low assets ergo a mediocre company.
MY
12/22/2013
12/22/2013
Donate a $1
