I initially bought into NOV back in January for two reasons. First, I assumed that the 50% oil decline is the most pessimistic as it could get (Inman, 2015). Second, I heard over Bloomberg that Warren Buffett has his holdings in it (GuruFocus, 2013). A couple of months later, I now heard that Buffett dismissed his investment in Exxon Mobil (XOM) and reduced his shares in NOV (Morgan, 2015). In fact, Buffett has been reducing his NOV shares effective Q2 of 2014; this is from 0.25% of his portfolio down to 0.09% in Q1 of 2015. On the other hand, he completely exited his XOM investment in Q4 of 2014. However, this is not the first time that he sold his 100% stake in XOM. He had once sold 100% of his stake back in Q4 of 2011when WTI crude was in the 80-110 price range and re-entered XOM in Quarters 2, 3, and 4 of 2013 when WTI is at the 90-110 price range. Only a stroke of bad luck that not more than a year later oil price dropped precipitously starting from the summer of 2014 to 2015, which led him to reduce his exposure in the energy sector and dented one of his known saying of "our favorite holding period is forever."
Buffett initially bought NOV in Q2 of 2012 and steadily increase his stake in until Q2 of 2013. An almost similar approach with XOM, but the difference is on the latter part he trimmed down his stake by 12-17% per quarter and a sudden major selling of 62.37% of his remaining NOV shares in Q1 of 2015.
With his forever changing into less than a year of holding period (in the case of XOM), should I sell my NOV shares now that he had almost minimum to no interest (from 8,880,000 shares down to 1,978,895 shares) in it?
That, I guess, is the hardest question to answer secondary to the fact that I am a beginner (started investing in US equities January 2015) and I do not want to be left behind (who does?) by the master.
I recently remodeled, modified, re-modified, re-modi-modified my approach into analyzing companies. It is only recently that I am looking back at each holding I have (total of 36 companies) and try to critically assess (retrospectively) whether I did an excellent decision in purchasing them.
In the case of NOV, I had to start from an overview of the industry or my version of top to bottom approach.
Part 1 Overview
First, I used Value Line’s and Morningstar’s competitors list which are associated if not higher ranking than NOV. It gave me the following list: Halliburton (HAL), Schlumberger (SLB), Baker Hughes (BHI), FMC Technologies (FTI), Helmerich & Payne (HP), and Cameron International (CAM). Second, I performed a quick ocular inspection in each of the companies’ Gross Margin and DE ratio whether it is increasing and declining respectively. Through this I was able to eliminate HAL. Third, I identified the companies who had given better than S&P500 return in over a decade (2005-2014) in terms of their market price performance and their return average as a group. This eliminated SLB. Fourth, I determined who provided the best return among the remaining companies respective to their book value and free cash flow over a decade. This step eliminated neither of the four, but with the process, FTI and CAM emerged as the top contender. Fifth, I determined their retained earnings whether it meets Buffett’s 10% of market value as a threshold to determine whether or not the management was able to somehow efficiently deploy 60% of the company’s capital into work. NOV trumpeted this one with 69% while the remaining three had 40%-58% range. Last step was for me to know the company’s share buyback plan. FTI showed the most share repurchase in a decade with a CAGR of -1.95%, while NOV shown the worst whereby it increased its shares in the same time period of 2.98% CAGR.
Part 2 (A) Evaluation
Now with the remaining four contenders for my hard earned money, I had to check their current headroom for providing dividends. I borrowed this concept from a business article (Doorn, 2015). This then eliminated FTI and CAM because they never provided any single cent of dividend in the past decade.
This finding also demarcates this long article and I chose to continue with NOV and HP and dropped FTI and CAM. I am thinking of assessing FTI and CAM later on (maybe).
With the current headroom to make future dividends, NOV easily defeated HP with 8.998% headroom and -0.99% for HP.
NOV had started its dividend program only in 2009 and according to NOV’s 2014 annual report, “the declaration and payment of future dividends is at the discretion of the Company’s Board of Directors and will be dependent upon the Company’s results of operations, financial condition, capital requirements, future outlook and other factors deemed relevant by the Company’s Board of Directors” (p. 29).
So for me, a semi-interested in dividend-yielding company, I should be firm when down the road the company suddenly stops giving out dividends (first reason for sell-off). Also important is to take note that NOV had a 77% increase in its dividend sometime mid-2014 that increased its payout ratio from 14.3 to 23.5 (Levitt, 2014; Morningstar). This is the period were the WTI crude oil price was hovering 92-107. Three months later, the 50% correction in WTI crude price happened. It lasted from September, 2014 to March, 2015 where it fell drastically from 92 to 44.84. Some analysts were being overly pessimistic and stated that oil could have more downside and maybe settle at $20 (Kaletsky, 2014).
With use of numbers, NOV’s free cash flow to equity (FCFE) had been declining long before the oil price collapse (NOV being overly confident with steady stream of cash flow maybe?-all this prior to the oil plunge).
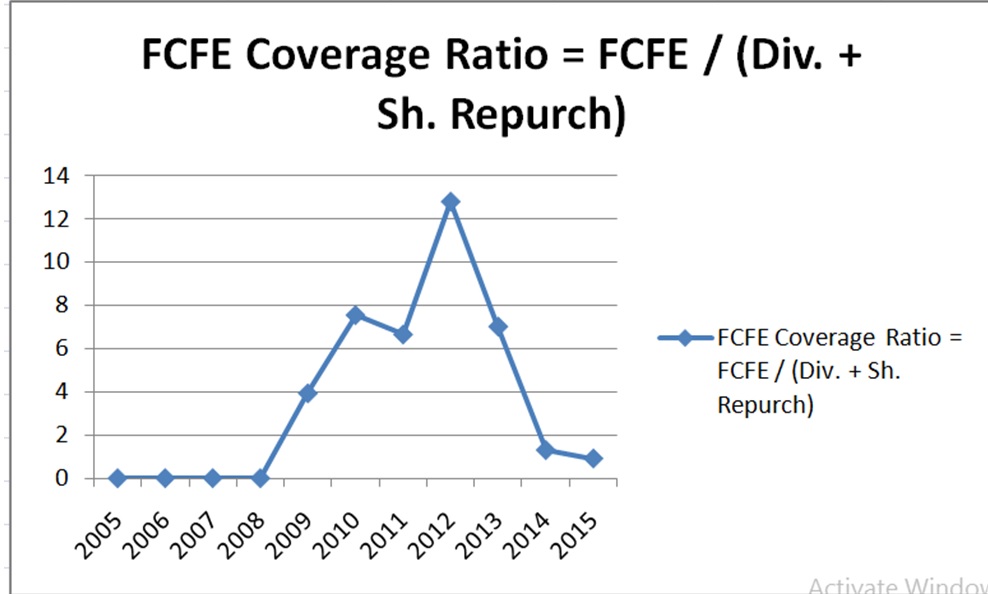
There are two reasons that I assume why NOV did initiate its dividend in the fourth quarter of 2009. First, NOV is anticipating that it can well cover its dividend going forward (See the FCFE ratio graph from 2008-2013). Second is that NOV’s market price had been stagnant at $40/share resistance.
NOV just displayed a 46% growth in its bottom line in 2008, despite the ongoing Great Recession, and had a book value of $30.26/share in the same year. The following year, NOV had decline in net income of an outstanding 24.74% but still a 9.87% growth from 2007. (On the other hand, looking and comparing the company’s top line would reveal much calming numbers)
The great recession had just ended in June 2009 (Economic Policy Institute, n.d.) and NOV’s stock price had already appreciated 72% (from 22/share to 38.87/share) during the first half of 2009 and had stagnated and was flirting with the $40 resistance from September 2009 to the April 2010.
Digging into NOV’s 2008 annual report, the company stated, “We have never paid cash dividends, and none are anticipated during 2009” (p. 30). The company also displayed an above average return compared to the S&P500 and its peers with the assumption that it reinvested the supposed dividends.
(NOV’s 2008 annual report)
Not bad at all.
In NOV’s 2009 annual report it stated, “On November 11, 2009 National Oilwell Varco’s Board of Directors approved a special one-time cash dividend of $1.00 per share of common stock along with the commencement of a regular quarterly dividend of $0.10 per share. The special cash dividend and the first quarterly dividend were paid on December 16, 2009 to each stockholder of record on December 2, 2009” (p. 31).
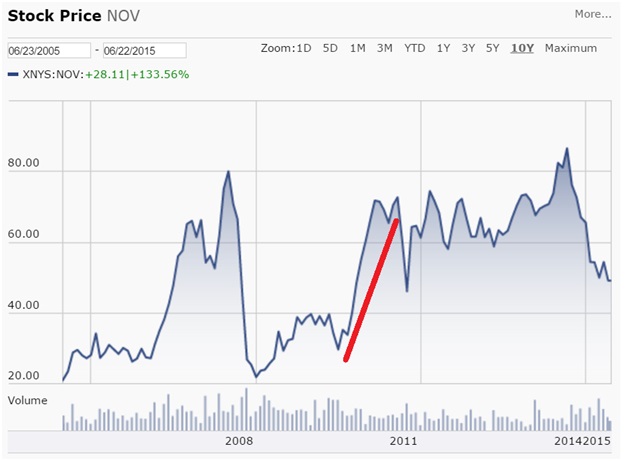
NOV’s share price only propelled well into and beyond the $40/share resistance only from September 2010 to February 2011. I am assuming there was an increase of demand in NOV’s shares because the dividend investors are noticing and piling in. But the dividend yield, excluding the special $1 dividend a share back then was an anemic 0.33% with a 30/share market price, but was a 2.9% yield during the special dividend announcement. I cannot really pinpoint why there was a sudden upward swing in its market price-an amazing 140% (from 30/share to 70/share) increase from mid 2010 to mid 2011. It was not Buffet (bought NOV in Q2 of 2012), and it was not the spinoff of DNOW because it happened just last year (Spin Doctor, 2014).
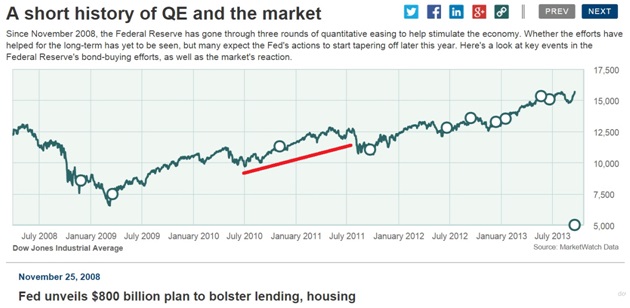
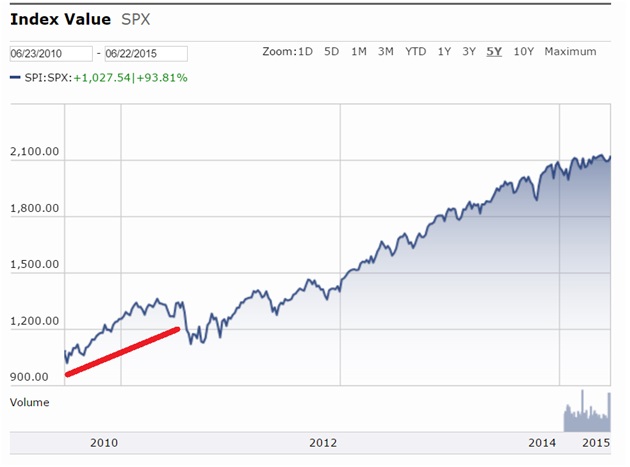
The only other speculation I have in mind why there was this ecstatic return in such a short period of time was the influence of the Fed’s quantitative easing program. In the two pictures immediately after this paragraph, I have highlighted (red line) the duration of the 100+ return of NOV in contrast to the QE program. On November 3, 2010, Federal Reserve added more to their QE program fresh from their initial buyback program of $1,100 USD (billion) and was to buy additional $600 billion in bonds. S&P500 also demonstrated similar surge and fall off in the same duration.
The only other speculation I have in mind why there was this ecstatic return in such a short period of time was the influence of the Fed’s quantitative easing program. In the two pictures immediately after this paragraph, I have highlighted (red line) the duration of the 100+ return of NOV in contrast to the QE program. On November 3, 2010, Federal Reserve added more to their QE program fresh from their initial buyback program of $1,100 USD (billion) and was to buy additional $600 billion in bonds. S&P500 also demonstrated similar surge and fall off in the same duration.
Anyhow, any future announcement that NOV will cut its dividend would definitely impact its market price negatively.
Part 2 (B) CEO
The CEO during these times was Merrill A. Miller "Pete", Jr. Mr. Miller is known in the oil business given his extensive background in the industry (Bloomberg, n.d.a). He had returned an outstanding annual average return of 11.98% (dividend reinvested) in NOV’s stock price throughout his tenure from 2001 to 2014 compared to S&P500’s 4.83% (dividend reinvested). He later on resigned and moved to becoming the executive chairman of the spinoff company NOW inc. (DNOW) and was replaced by Clay C. Williams as NOV’s new CEO in 2014. “This action demonstrates National Oilwell Varco’s commitment to provide long-term value to our stockholders,” said the NOV’s new CEO Clay C. Williams. “With its strong management team in place, NOW is well-positioned to be a successful independent company” (Business Wire, 2014). Two months later (July 16, 2014), Transocean (RIG) board agreed to have Mr. Miller become the CEO of the struggling Transocean (RIG; Transocean..., 2014). RIG struggled in all fundamental aspects in 2014 and still has negative $2 Billion in its bottom line TTM (Morningstar).
Clay C. Williams, on the other hand, has been the CFO of NOV from 2005-2012. He had moved up to become the President of Ameron International Corporation (AIC) since 2011 until present (Bloomberg, n.d.b). AIC was a former competitor of NOV, but was later acquired for $777 million in 2011; the NOV acquired Ameron International Corporation (“Ameron”) which allowed it to expand its Fiberglass & Composite Tubulars business (Crowe, 2011; NOV’s 2011 annual report). AIC was retained by NOV after the DNOW Inc. spinoff. “NOV Ameron is a multinational manufacturer of highly engineered products and materials for the industrial, energy, transportation and infrastructure markets. We operate businesses in North America and South America” (National Oilwell Varco, n.d.).
So far, NOV’s market price has been in the negative territories since Mr. Williams became the CEO. (Unfortunate times?).
Part 2 (C) Oil Rigs
“National Oilwell Varco is a worldwide leader in the design, manufacture and sale of equipment and components used in oil and gas drilling and production operations, and the provision of oilfield services to the upstream oil and gas industry” (Press Release, 2014).
Clearly, oil companies are cutting down its capital expenditures (CAPEX) in drilling. Numbers say it all. 12% decline year-over-year, approximately totaling to $140 Billion USD drop in cash flow for CAPEX (Hussain, 2015; US Energy Information Administration, 2015). In addition, from a high of 2,031 in September 2008 there are now only 857 active oil and gas rigs in the US in the week ending June 19, 2015 (Chamberlin, 2015).
I am assuming that no doubt that NOV’s bottom line will be hit with this decline in CAPEX. This affectation may reflect later on in NOV’s 2015 annual report (second reason for sell-off).
Part 2 (D) Shares repurchased
“On September 30, 2014, the Company announced that its Board of Directors authorized a share repurchase program to purchase up to $3 billion of the Company’s outstanding common stock. The Company may repurchase its shares on the open market at prevailing market prices. The timing and actual number of shares repurchased will depend on a variety of factors including market conditions and regulatory considerations. The duration of the share repurchase program is 36 months, although it may be increased, extended, suspended or discontinued without prior notice” (NOV’s 2014 annual report).
There are two events that I want to relate following this September 2014 announcement. The two events are the WTI crude price and NOV’s market price performance. WTI crude was hovering only from 70-100 in the period of 2010-2014 prior to announcement and I am assuming that the management did not foresee it to go downwards, which had terribly affected NOV’s market price from a high of 86.43/share (in August 29, 2014) down to 49.16/share (June 22, 2015); a negative 43% return as of the moment.
Morningstar’s TTM data reveals that NOV had already spent $2,888 USD (million) on common stock purchase in the first eight of the 36 months when it stated the repurchase plan. If this is applied, then NOV’s average repurchase price will be somewhere between $49.16 and $76/share.
Hopefully management will continue repurchasing these low priced shares conservatively as no one knows where the bottom will be at. I am also looking forward for the company to be conservative with its capital expenditures on NOV’s rig construction and refurbishment. In contrast, I found out that NOV already surpassed its 10-year DE average of 0.11 and now its DE is at 0.22 TTM (Morningstar). NOV’s DE ratio had been increasing since 2011 in a CAGR of 15.39%.
Part 2 (E) Hydraulic fracturing
On the imaginative side, I guess management was already anticipating a downturn in oil price that is why it is preparing to spend $3 billion in its shares. Hydraulic fracturing (HF) has been in existence since 1947 and it was started by a company named Stanolind Oil Company in Kansas. In 1949, Halliburton Oil Well Cementing Company patented the procedure and called it HydraFrac Process (Energy and Capital, n.d.). Only recently, when there was a marriage between HF wells with horizontal drilling that brought the excess production of the black gold (Rapier, n.d.). There are good and bad results of HF.
Good video (https://www.youtube.com/watch?v=nDjCsAlgSKc), and
Bad video (https://www.youtube.com/watch?v=nCyHS7fKmXI);
In addition to it, I am assuming that the latest developments in the HF business have been admired by the U.S. government indirectly because of the three benefits it provides. First, the HF process provides less carbon dioxide emissions (Fracking Leads to Cleaner Air, 2012). Second, it gives more jobs, an estimated 600,000 to 1 million jobs since 2010 (Energy and Capital, n.d.; Coletti, n.d.). Lastly, HF is necessary to exist so as to maintain U.S’s energy production at a certain level. “Without fracking, the entire North American oil and gas industry would come to a screaming, painful halt” (para. 4, Energy and Capital, n.d.).
With these findings, I am still relying on David Einhorn’s recent public presentation in the 20th Annual Sohn Investment Conference in New York on May 4, 2015. He was referring to the HF industry as a whole when he stated, “none of them generated excess cash flow, even when oil was at $100 a barrel” (para. 4, Bloomberg, 2015). (See entire powerpoint presentation on this link https://www.greenlightcapital.com/926698.pdf).
Part 3 (A) 10-year Performance (in CAGR)
Improvement in the following:
Top line 16.53% up
Operating margin 5.08% up
EPS 20.39% up
Dividend (from 2009) 41.86% up
Book value 15.82% up
Return on invested capital 1.02%
Return on equity 1.10% up
DE ratio -2.84% down
Underperformance in the following:
FCFE coverage ratio (from 2009) -18.81% down
Dividend coverage ratio (from 2009) -1.56 % down
CAPEX 18.88% up
Shares 2.70% up (just initiated share repurchase program)
Sustainable growth rate -6.09% down
NOV would clearly (I assume) be having troubles with its dividend in the next coming years. NOV’s management should be prudent and should discontinue handing out dividends to conserve its cash flow. Value Line is expecting a decline in top line in 2016 and 2017. In addition, both Morningstar and Yahoo Finance have a negative PEG ratio for NOV.
Part 3 (B) Valuations
NOV market price as of 6/23/2015: $49.05/share
Financial Times (31 analysts): High price $70/share
Median price $50/share
Low price $40/share
Morningstar: $66/share
Value Line: High price $75/share
Low price $50/share
PE, PBV, PS (10 year average): $83.50/share
Hagstrom five-year DCF: $119.28/share
Hagstrom ten-year DCF: $213.07/share
My own valuation: High price 101.39/share
Low price 82.63/share
Summary: I am thinking that when the oil rig count start going up again (that is a couple of years or more from now), NOV will start to appreciate again near its intrinsic value. For now, I am anticipating further selling on its shares.
(Do not consider an expert advice or a buy advice)
Thank you!
By Mark Yu
-End-
References
Bloomberg. (2015). Greenlight’s Einhorn Attacks Frackers, Says Pioneer Burns Cash. Retrieved from http://www.bloomberg.com/news/articles/2015-05-04/greenlight-s-einhorn-attacks-frackers-says-pioneer-burns-cash
Bloomberg. (n.d.a). National Oilwell Varco Inc. Retrieved from http://www.bloomberg.com/research/stocks/people/person.asp?personId=215698&ticker=NOV
Bloomberg. (n.d.b). National Oilwell Varco Inc. Retrieved from http://www.bloomberg.com/research/stocks/people/person.asp?personId=745445&ticker=NOV
Business Wire. (2014). National Oilwell Varco, Inc. Announces Completion of Spinoff of NOW Inc.; Resignation of Merrill A. “Pete” Miller, Jr. and Election of Clay C. Williams. Retrieved from http://www.businesswire.com/news/home/20140530005652/en/National-Oilwell-Varco-Announces-Completion-Spinoff-Resignation#.VYjMz_lViko
Chamberlin, A. (2015). Rig Count Falls by 2: Will It Turn Next Week? Retrieved from http://marketrealist.com/2015/06/rig-count-falls-just-2-will-turn-next-week/
Coletti, K. (n.d.). Hydraulic fracturing in the Marcellus Shale region of the United States. Retrieved from http://www.northeastern.edu/nuwriting/hydraulic-fracturing-in-the-marcellus-shale-region-of-the-u-s/
Crowe, D. (2011). National Oilwell Varco Completes Acquisition of Ameron. Retrieved from http://labusinessjournal.com/news/2011/oct/05/national-oilwell-varco-completes-acquisition-amero/
Doorn, P. (2015). 10 S&P 500 dividend stocks with room for higher payouts. Retrieved from http://www.marketwatch.com/story/10-sp-500-dividend-stocks-with-room-for-higher-payouts-2015-02-18
Economic Policy Institute. (n.d.). The Great Recession. Retrieved from http://stateofworkingamerica.org/great-recession/
Energy and Capital. (n.d.). Investing in Fracking Stocks. Retrieved from http://www.energyandcapital.com/resources/investing-in-fracking
Fracking Leads To Cleaner Air. (2012). In Investors.com. Retrieved from http://news.investors.com/ibd-editorials/082012-622858-fracking-drops-carbon-emissions-to-new-low.htm?p=full
GuruFocus (2013). Warren Buffett's Top Growth Stocks He Keeps Buying. Retrieved from http://www.forbes.com/sites/gurufocus/2013/09/13/warren-buffetts-top-growth-stocks-he-keeps-buying/
Hussain, Y. (2015). Capital retreat to rise as oil and gas companies see $140B drop in cash flow: RBC. Retrieved from http://business.financialpost.com/news/energy/capital-retreat-to-rise-as-oil-and-gas-companies-see-140b-drop-in-cash-flow-rbc?__lsa=8633-c065
Inman, P. (2015). Oil price dips below $50 for first time since recession. Retrieved from http://www.theguardian.com/business/2015/jan/07/oil-price-brent-crude-falls-below-50-barrel
Kaletsky, A. (2014). The reason oil could drop as low as $20 per barrel. Retrieved from http://www.reuters.com/article/2014/12/30/us-kaletsky-oil-idUSKBN0K81G720141230
Levitt, A. (2014). NOV Stock Spinoff Is No Slouch. Retrieved from http://investorplace.com/2014/06/nov-stock-dnow/#.VYiu5PlViko Morgan, S. (2015). Buffett Dumps a Lot of Oil Holdings - How About You? Retrieved from http://www.dailyfinance.com/2015/03/02/buffett-dumps-oil-holdings/
Marketwatch. (n.d.). A short history of QE and the market. Retrieved from http://projects.marketwatch.com/short-history-of-qe-and-the-market-timeline/#1
National Oilwell Varco. (n.d.). Overview of Ameron. Retrieved from http://www.nov.com/ameron.aspx
Press Release (2014). National Oilwell Varco, Inc. Announces Completion of Spinoff of NOW Inc.; Resignation of Merrill A. “Pete” Miller, Jr. and Election of Clay C. Williams. Retrieved from http://www.marketwatch.com/story/national-oilwell-varco-inc-announces-completion-of-spinoff-of-now-inc-resignation-of-merrill-a-pete-miller-jr-and-election-of-clay-c-williams-2014-05-30
Rapier, R. (n.d.). Fracking Has Been around since 1949, Why the Recent Controversy? Retrieved from http://globalenergyinitiative.org/insights/58-fracking-has-been-around-since-1949-why-the-recent-controversy.html
Spin Doctor. (2014). The Time Is DNOW! National Oilwell Varco Completes Spinoff of NOW Inc. Retrieved from http://www.stockspinoffs.com/2014/06/02/time-dnow-national-oilwell-varco-completes-spinoff-now-inc/ US Energy Information Administration. (2015). Upstream capital expenditure declined 12% year-over-year in fourth-quarter 2014. Retrieved from http://www.eia.gov/todayinenergy/detail.cfm?id=20512
Transocean... (2014). In Offshoreenergytoday.com. Retrieved from http://www.offshoreenergytoday.com/transocean-proposes-ex-nov-ceo-as-vice-chairman/